 My name is Mike Heroux and I am the author of The Dividend Guy Blog, The Dividend Monk, and Moose Markets (yes, I thrive on staying busy)! I am also the co-owner and portfolio manager at Dividend Stocks Rock. I have been told that I have an unusual sense of humor for a “nerdy finance guy”. Point being, I believe I have a rather unique writing style that does tend to appeal to a rather discerning audience who may be looking for something out of the ordinary.
I started investing in 2003 in natural resources & mining stocks with $0 in hand and a line of credit of $20,000. During my first three years of trading, I accumulated a $50,000 down payment, net of debt, for my first house. I then converted my strategy to a dividend growth portfolio in 2010. Those who follow my blog have seen my results so far, but if you don’t know the blog, you may want to dig a little bit more into my mind prior to deciding if this strategy is the right one for you. The purpose of this paper is to share with you the seven dividend principles I follow when investing in the stock market. I have linked to all sources used for further reading.
I used to struggle with the same issues thousands of self directed investors deal with in their own portfolios routinely:
Which stocks to buy?
When to sell them?
Is a correction coming? Should I go all cash?
How to find the time to manage my portfolio?
How to diversify?
How to avoid dividend cuts?
My investing journey started on the right foot, but I rapidly realized how demanding my investing strategy was in terms of time. I was condemned to spend hours analyzing the market each day to make sure my holdings were doing well and buying/selling stocks almost each week to capture more gains. I was chasing returns without taking time to catch my breath.
When 2008 happened, I was somewhat lucky to have had most of my investments cashed out to buy my house. Then, even if I had suffered a 27% paper loss, it wasn’t the end of the world. At that time, my life was changing fast. I became a financial planner, completed my MBA in financial services with honors on top of being the father of two amazing children. I did not have two to three hours a day to give to Mr. Market anymore!
I realized my portfolio lacked structure and the components required to build a sturdy base. I made good money from the stock market, but I was taking unnecessary risks to achieve my investing goals.
In 2010, I bought The Dividend Guy Blog as I was truly intrigued by the power of dividend growth investing. From that point on, I was determined to create a portfolio strategy that would allow me to benefit from that strategy as a solid foundation.
I’m not exactly following the classic buy & hold strategy recommended by many dividend investors. I don’t chase yield and I don’t necessarily fall for classic dividend holdings. I built a core portfolio of stocks I would probably never sell, but I also liked trading a few stocks to make additional healthy profits. This is my way to capture market inefficiencies while the bulk of my portfolio is generating steady and predictable returns.
Imagine if you could still invest actively in individual stocks while building a rock-solid portfolio. Imagine if you could use the fundamental principles of investing without getting bored or having to read hundreds of pages of stock research regularly each month.
The Dividend Stocks Rock (DSR) portfolio follows the same dividend growth model I use to manage my own portfolio. In fact, all my personal holdings are integral components of our DSR model. I didn’t come up with these investing rules out of the blue. Each rule has been written after several years of trading dividend stocks, reading through many financial research publications, and listening to top investors and portfolio managers’ wisdom. Here’s the foundation of my investment strategy:
Principle #1: High Dividend Yield Doesn’t Equal High Returns
Principle #2: Focus on Dividend Growth
Principle #3: Find Sustainable Dividend Growth Stocks
Principle #4: A Strong Dividend Triangle Ensures Future Growth
Principle #5: Buy When You Have Money in Hand – At the Right Valuation
Principle #6: The Rationale Used to Buy is Also Used to Sell
Principle #7: Think Core, Think Growth
7 Dividend Stocks Rock Principles
The first question that comes to mind as an investor is: why choose dividend investing over all the other investing strategies used by investors? In 2011, Ridgeworth Investments highlighted the main benefits of dividend investing:
Corporate Finance Health. The dividend evolution of a company is a transparent image of the company’s ability to generate wealth for its investors over time. Dividend growth is a direct translation of management’s confidence in the company’s future.
Significant Source of Total Return. From 1926 to 2011 Dividend paying stocks are responsible for over 43% of the S&P 500 returns (source JP Morgan Asset Management). Therefore, almost half of your total return is found in your dividend payments over time.
Important Impact on Stock Returns. Research has proven the impact of a dividend announcement. On average, a dividend increase pushes the stock higher by 2% (Aharony and Swary,1980), a dividend initiation increases the stock value by over 2% (Michaely, Thaler & Womack, 1995), and a dividend cut decreases the stock value by 9.5% (Healy and Palepu, 1988).
Lower Relative Volatility. Have you ever heard of the expression “getting paid to wait”? During bearish markets, dividends are like a buffer to your portfolio valuation. While the value of your stocks fluctuate, you still receive your dividend payout which reduces your portfolio volatility.
Higher Returns Regardless of Interest Rate Movements. Bond holders think they hold safe securities until the day the FED raises its interest rate. Then, they realize bond values can drop as fast as a stock in a market crash. With interest rates at comparatively low levels, dividend stocks become a great solution for income dependent investors.
Unfortunately, not all dividends are created equal. Among the vast world of dividend stocks, there are many mediocre companies failing their shareholders with dividend cuts or weak financial results. Here comes another bunch of questions:
Which kind of dividends should you aim for?
High yield or low yield?
What about Dividend Growth?
Which kind of payout ratio is reasonable?
Here are my answers to these questions as we look at our “Principles” in more detail.

High Dividend Yield Doesn’t Equal High Returns
Some investors look for the highest dividend yield possible. Retirees are among the most avid income seeking investors. They hope to build a portfolio generating a 5%+ yield to never have to touch their capital. Did you know that the highest dividend yield stocks often underperform more “reasonable” yielding stocks? The Hartford Mutual Funds company wrote:
“The study found that stocks offering the highest level of dividend payouts have not performed as well as those that pay high, but not the very highest, levels of dividends.”
SECOND-QUINTILE STOCKS OUTPERFORMED MOST OFTEN FROM 1929–2017
Percentage of Time Dividend Payers by Quintile Outperformed the S&P 500 Index (summary of data in FIGURE 4)

Performance data quoted represents past performance and does not guarantee future results. Source: Wellington Management.
Following this principle, I usually aim for dividend yields over 2.00% but under 5%. I can afford to wait several years, and see the dividend payment grow into the higher yield range. Keep in mind that there is no free lunch in finance. If a company is paying a yield over 5%, it must be related to one of the following two explanations:
#1 The market has lost faith in the company. The stock price has dropped, and it leads to a higher yield. A price drop could be related to bad earnings, lack of growth vectors, a major threat coming (Amazon going after the brick & mortar retail industry) or a challenging environment. In all cases, investors must proceed with caution as the company could eventually have to cut its dividend to preserve its business.
#2 The company business model is not based on growth, but rather on profit distribution. REITs are the best example of companies that are most likely to be stable and distribute the bulk of their income to shareholders. By their nature, they must distribute a high percentage of their profit. Some of them make a great source of income for retirees.
I understand several income seeking investors may not want to “waste” their money on 2% yielding stocks. However, many retirees would benefit from considering the investment of a portion of their portfolio in lower yielding holdings. After all, most investors alive today may live until 85 to 90. Therefore, there is plenty of time to invest in solid companies with growing dividends.
In 2018, we created retirement portfolios generating between 4.5% and 5% yield to ensure a decent source of income. We made sure the holdings increased their dividends to at least match the rate of inflation. We succeeded in building those portfolios following our investing principles along with 3 additional rules:
Aim for 4-6% yield for most stocks
Add some Dividend growth to cover inflation
Avoid sector concentration
I was reluctant at first to focus on higher yielding stocks, but I found that with a strict methodology, it was possible to sacrifice a part of growth to gain a higher yield without putting our capital in jeopardy. It’s all about finding a balance and making sure the chosen companies continue to pay their dividends and grow the dividend payouts as well.
Focus on Dividend Growth
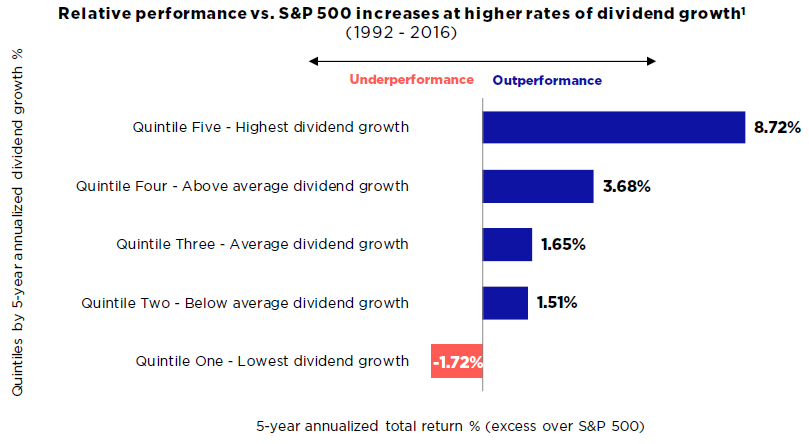
Beyond the dividend yield, there is dividend growth. To be honest, the dividend yield doesn’t matter to me. I even picked stocks with yield as low as 1% and they are part of my top performing assets. What really caught my attention is management’s will to increase this payout year after year. Here’s an interesting quote from Saturna Capital:
“Indeed, dividend growth has been a much larger determinant of equity returns in this new era of low benchmark rates and higher levels of uncertainty.”
Source: Bloomberg, Reality Shares Research. Past performance does not guarantee future results.
Many research projects throughout the past 50 years have been conducted on dividend growers vs. other companies. All of them show that dividend growers are among the best in kind on the market. Then again, the market will on occasion go down in values, and we can’t do anything about that. However, we can pick companies that will not only keep their dividend alive but will also keep increasing it.
Source: Ycharts
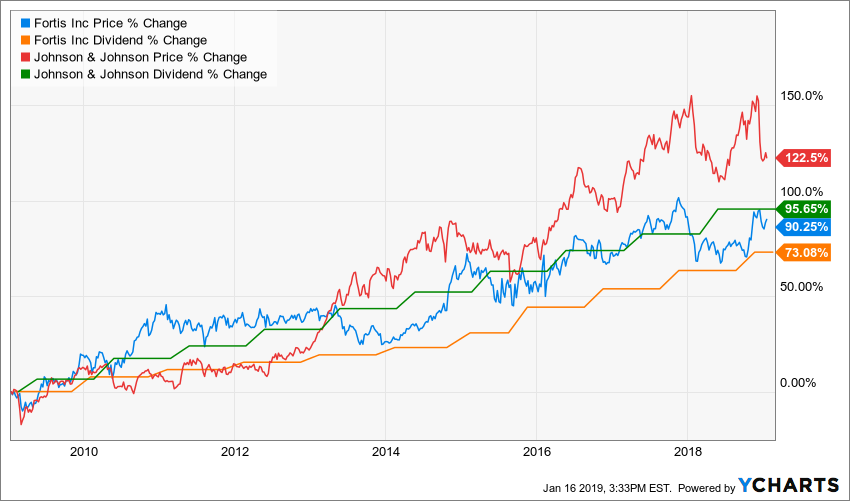
For example, Fortis (FTS.TO) and Johnson & Johnson (JNJ) could be considered very boring stocks with limited hype around them. However, I get very excited when I see a steady dividend growth rate over more than 10 years like these two. Not all my holdings show such impressive consistency, but most of them show a 10 year+ dividend increase streak. I like getting paid during market downturns!
At DSR, we look at dividend growth over 5 and 3 years. We ensure both metrics are positive to ensure that management is dedicated to return more wealth to investors over time. This is also a great indicator of management’s confidence in the company’s future. We have also developed a Dividend Safety Score highlighting strong dividend growers. This score, from 1 to 5, tells you which kind of dividend policy you should expect. It can be interpreted as follows:
5 = Stellar dividend – Past, present and future dividend growth perspectives are marvelous.
4 = Good dividend – The company shows sustainable dividend growth perspectives.
3 = Decent dividend – Don’t expect much more than 3-5% dividend growth.
2 = Dividend is safe but – Not likely to increase this year.
1= Dividend Trash – It has been cut or this situation is not sustainable.
You can imagine that we aim at building our portfolios with only 4’s and 5’s ratings.

Find Sustainable Dividend Growth Stocks
As a dividend growth investor, the last thing I want is to see a company in my portfolio cutting its dividend payment. After all, we invest to receive these precious distributions, and we base our retirement plan on them. The last thing we want to see is a company slashing their dividend, and leaving us on the side of the road.
The first metric to look at when you search for a sustainable dividend growth stock isn’t payout ratios. It’s the dividend growth itself. An absence of dividend growth is the first red flag for a dividend cut. Many high yielding companies don’t increase their payout for several years in a row. At DSR, we believe such investments should be ignored. A stagnating dividend is slowly, but surely getting eaten up by inflation. Year after year, your buying power is reduced by 1-3% due to inflation. It’s like a dividend cut in disguise.
Then, a thorough examination of the company’s ability to pay and increase its dividend is required. You can use various metrics to determine the sustainability of a dividend.
Payout ratio: The payout ratio is the percentage of net income that a company pays out as dividends to common shareholders.
Payout Ratio = (Total Dividends (Common and Preferred) per Share)/(Earnings per Share)
Cash payout ratio: Proportion of free cash flow (after preferred dividends) that is paid as dividends to common shareholders.
Cash Dividend Payout Ratio = Common Stock Dividends / (Cash Flow from Operations – Capital Expenditures – Preferred Dividends Paid)
AFFO or FFO payout ratio: The Adjusted Funds from Operations or Funds from Operations payout ratio is like the regular payout. However, it uses funds from operations. It describes the amount of income a company produces before deprecation expenses and income tax. This measure is often used by REITs.
AFFO payout ratio = Total Dividends (Common and Preferred) per Share / (Adjusted) Funds From Operations (Pretax Income + Depreciation and Amortization + Depletion)
Net Interest Income payout ratio: Then again, the NII payout ratio is similar to the regular payout ratio. The net interest income is the difference between the revenue that is generated from a bank’s assets and the expenses associated with paying its liabilities. This formula is used for BDC’s (Business Development Companies).
Distributable Cash payout ratio: Finally, the distributable cash flow means all cash of the Company that the Managers determine is available for distribution. We sometimes use this measure for MLP’s (Master Limited Partnerships) or investment firms.
The idea is to use the right metric for the right type of industry. If you are unsure which metric to use, you can read the company’s quarterly earnings press release. Management will often provide which calculation they use and its evolution from one quarter to another.
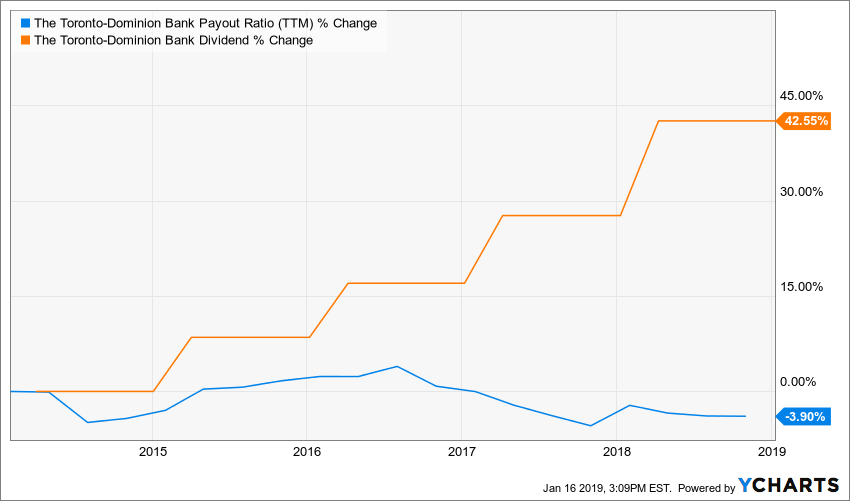
In an ideal world, the payout ratio would remain stable while the dividend would increase. A raising payout ratio gives you an indication future dividend growth may remain modest. While a decreasing payout ratio tells you earnings are growing faster than the dividend.
source: Ycharts.
If you want to learn more about how to calculate the payout ratio, you can register for our free webinar replay of “Make Sure Companies Pay Their Dividend and Don’t Cut It”.
I discuss major concerns we all have regarding our holdings like how do we make sure our stocks continue paying their dividends? Even better, how can we make sure companies we hold will increase their dividends going forward? I dig into how earnings and payout ratios are calculated, and I also have a special section about REITs too!
This covers which type of dividend stocks you should look for. But the dividend payout is only the result of a sound business model. There are other metrics to consider prior to buying a dividend stock. These metrics are linked directly to the company and not its payout.

A Strong Dividend Triangle Ensures Future Growth
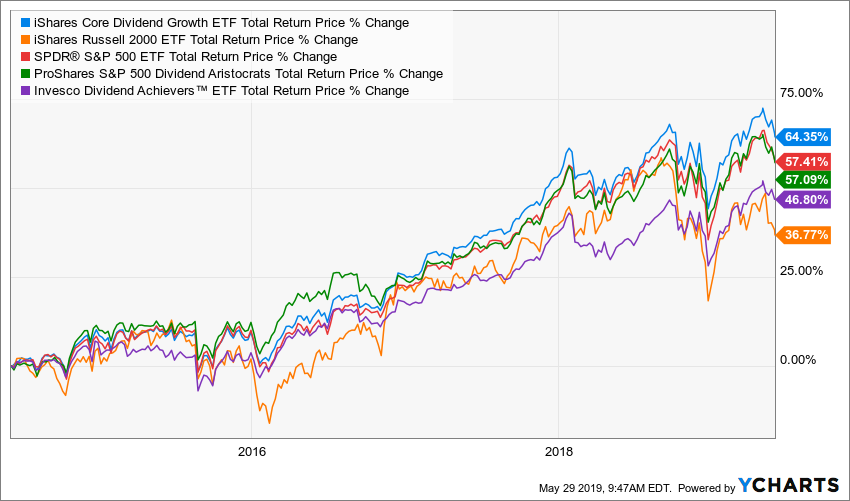
When you think about what the dividend truly represents for a company, you quickly understand it’s the “extra money” left in the bank account once all profitable projects have been funded. Instead of leaving this money sleeping in a bank account, the company can generate more interest in its stock by distributing dividends. Businesses which pay dividends and increase them over time tend to show similar characteristics that will enable them to thrive over the long haul. Most classic dividend growth ETFs show how they match the S&P 500 total returns and beat the Russell 2000:
source: Ycharts
How can you find these marvels? This is why you need other financial metrics to identify companies that will be able to sustain and increase their dividend for the next 10 years. When you think about it, dividend growth investing’s foundation is linked to 3 pillars I call the “Dividend Triangle”.
First, the company must make revenue. Without revenues, there is nothing, right? Then, those revenues must grow year after year to ensure the company’s sustainability.
Second, the company must be able to generate earnings from those revenues. Then again, if you are looking for dividend payment growth in the future, you need to see rising earnings as well.
Third, the company must pay an increasing dividend. If management is not on board with this policy, I quickly lose interest in the stock.
At DSR, we look at the 3 and 5-year metrics for Sales and Earnings per Share (EPS) growth. We only select companies showing growth on both the 3 and 5-year periods. Since an economic cycle lasts between 5 and 8 years, a strong company should be able to post increasing sales and earnings over these periods.
DSR STOCK METRICS
3 year revenues = positive
5 year revenues = positive
3 year EPS growth = positive
5 year EPS growth = positive
Why look for these metrics? Technically, you can’t expect to pay dividends if you don’t make money (earnings per share). Following the same train of thought; it’s impossible to continuously increase dividend payouts without increasing the EPS. But in order to increase the EPS, you need to increase your revenues (sales). The more sales, the higher EPS (if your margins are positive of course!). And the higher the EPS growth, the higher the chances of seeing an excess of cash flow converted into dividend increases.
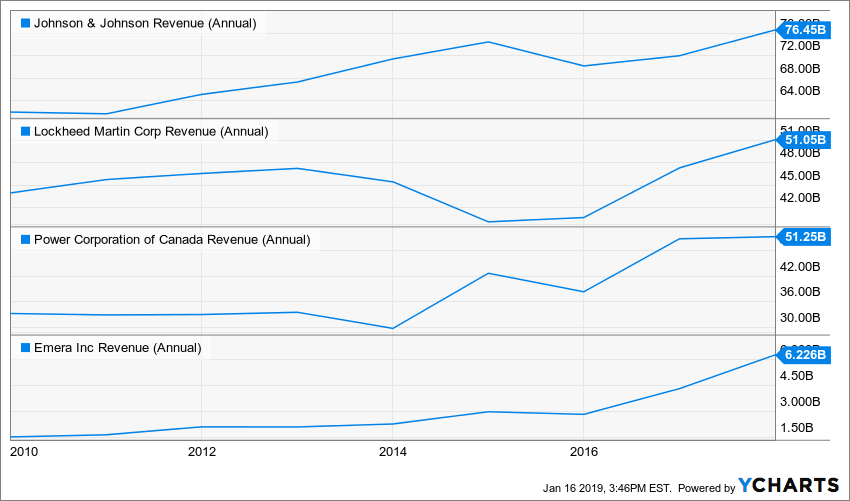
The reason why I don’t require a 5% or 10% growth or the one-year data on both metrics is to avoid discarding strong companies who have run into small bump in the road. As you can see in the following graph, many great companies will experience a rough year of sales on occasion.
Source: Ycharts
This doesn’t mean they are not good companies to include in your portfolio. It is important to keep in mind that revenues can’t always climb higher every year, and it’s only normal that there are small, temporary declines in sales. The first 4 dividend investing principles are not the ingredients of a magic formula that will guarantee your investing success. However, it will help you focus on the right stocks. Overall, I follow 7 investing principles that have been proven and provided me with great returns since 2010, the year I started to pick dividend stocks.
Dividend Stocks Rock was created following the same principles in 2013. Since that date, none of our portfolio has suffered a single dividend cut. While our methodology isn’t flawless, it is a great start for any dividend growth investor.
If you want to learn more about those 7 investing principles, you can keep reading and find out what Dividend Stocks Rock has to offer. If you have read enough and want to start using Dividend Stocks Rock, you can select the DSR membership option that suits your needs and benefit from our 60 days no questions asked refund policy.

Buy When You Have Money in Hand – At the Right Valuation
One of the most debated questions among investors is “when is the right time to buy a stock”? There are many ways to determine the “perfect time” to add shares to your portfolio. Most of them are just gimmicks to take money out of your wallet. Or put simply; they are playing Monday morning quarterback!
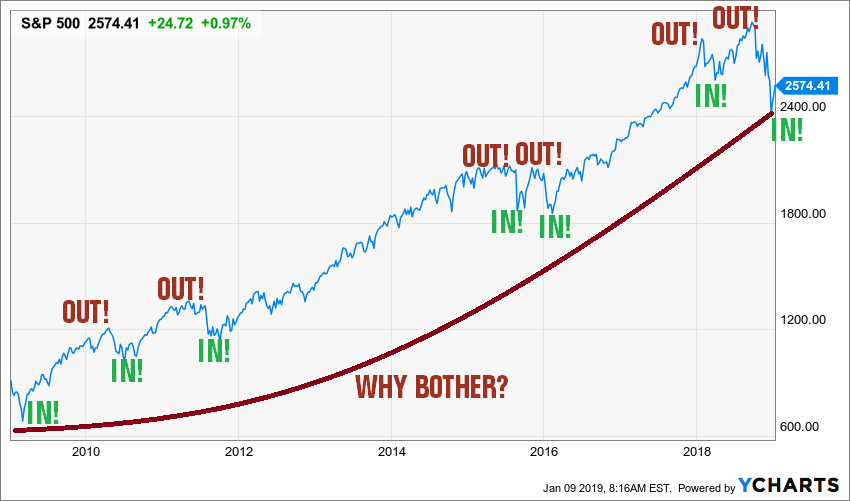
At DSR, we would rather buy great companies at any timing. Sleeping money is always a bad investment. Doubts easily get in the way when you wait with a pile of cash to invest. Is -10% enough to start investing? Should you wait until it gets to -20% Darn! The market bounces back by 5%, did you miss your opportunity? Those questions come around one after the other without a clear answer.
Source: Ycharts.
“It would be wonderful if we could avoid the common setbacks with timely exits.”
– Peter Lynch
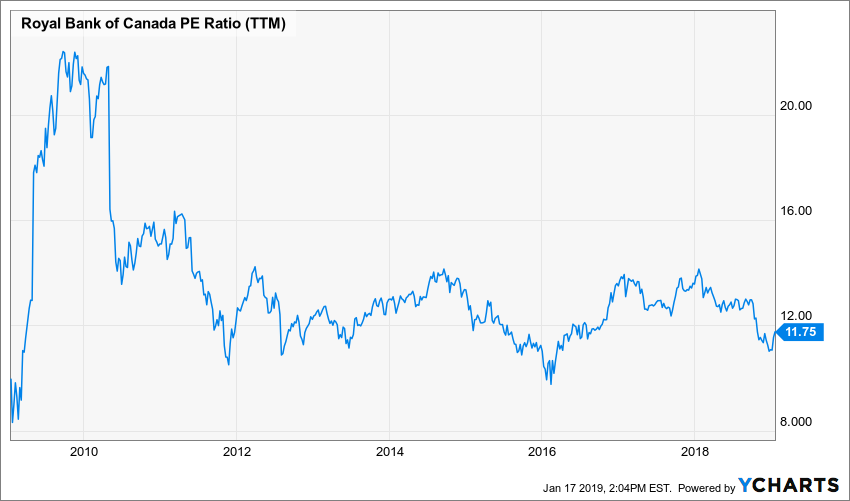
However, it doesn’t mean that you should buy everything you see because you have some savings aside. There is valuation work to be done. In order to achieve this task, I will start by looking at how the stock market valued the stock over the past 10 years by looking at its Price-Earnings (PE) ratio:
Source: Ycharts
This gives you a good idea of how the stock market values the stock you are considering. But, the PE ratio is not enough. Since the PE depends on the earnings per share (EPS), this metric could be altered by accounting rules. Major modifications such as the 2018 Tax Reform Act affected many companies with one-time events which significantly impacted earnings.
As a dividend growth investor, I also like to consider the value of a company based on its dividend perspectives. I use the dividend discount model (DDM) with a double stage dividend growth assumption. The double stage calculation enables me to select a dividend rate for the first ten years (to reflect if I’m bullish or bearish for the short term) and then use another growth rate for the following years.
Here’s an example of valuation calculation with Royal Bank (from early 2019 numbers):
| Input Descriptions for 15-Cell Matrix | INPUTS | |||
| Enter Recent Annual Dividend Payment: | $3.92 | |||
| Enter Expected Dividend Growth Rate Years 1-10: | 6.00% | |||
| Enter Expected Terminal Dividend Growth Rate: | 6.00% | |||
| Enter Discount Rate: | 9.00% | |||
| Discount Rate (Horizontal) | ||||
| Margin of Safety | 8.00% | 9.00% | 10.00% | |
| 20% Premium | $249.31 | $166.21 | $124.66 | |
| 10% Premium | $228.54 | $152.36 | $114.27 | |
| Intrinsic Value | $207.76 | $138.51 | $103.88 | |
| 10% Discount | $186.98 | $124.66 | $93.49 | |
| 20% Discount | $166.21 | $110.81 | $83.10 | |
Please read the Dividend Discount Model limitations to fully understand my calculations.
From these calculations, I can expect a return on my investment of 9% if I buy shares at $138 and Royal Bank increases its dividend by 6% forever. If I think Royal Bank could surf on strong economic tailwinds in the first decade, I could modify my calculations and use a 8% dividend growth rate.
| Input Descriptions for 15-Cell Matrix | INPUTS | |||
| Enter Recent Annual Dividend Payment: | $3.92 | |||
| Enter Expected Dividend Growth Rate Years 1-10: | 8.00% | |||
| Enter Expected Terminal Dividend Growth Rate: | 6.00% | |||
| Enter Discount Rate: | 9.00% | |||
| Discount Rate (Horizontal) | ||||
| Margin of Safety | 8.00% | 9.00% | 10.00% | |
| 20% Premium | $296.35 | $196.30 | $146.34 | |
| 10% Premium | $271.66 | $179.95 | $134.15 | |
| Intrinsic Value | $246.96 | $163.59 | $121.95 | |
| 10% Discount | $222.26 | $147.23 | $109.76 | |
| 20% Discount | $197.57 | $130.87 | $97.56 | |
Now, the intrinsic value of RY is up to $163.59. If I think I’m being too generous, reducing the terminal growth rate by 1% to 5%, would bring me back to $131.12.
| Input Descriptions for 15-Cell Matrix | INPUTS | |||
| Enter Recent Annual Dividend Payment: | $3.92 | |||
| Enter Expected Dividend Growth Rate Years 1-10: | 8.00% | |||
| Enter Expected Terminal Dividend Growth Rate: | 5.00% | |||
| Enter Discount Rate: | 9.00% | |||
| Discount Rate (Horizontal) | ||||
| Margin of Safety | 8.00% | 9.00% | 10.00% | |
| 20% Premium | $211.68 | $157.34 | $124.81 | |
| 10% Premium | $194.04 | $144.23 | $114.41 | |
| Intrinsic Value | $176.40 | $131.12 | $104.01 | |
| 10% Discount | $158.76 | $118.00 | $93.61 | |
| 20% Discount | $141.12 | $104.89 | $83.20 | |
As you can see, the DDM model is highly sensitive. The best course of action remains to invest when you have money on hand. However, using the DDM to compare a few candidates for your portfolio in the same sector would work well. Principles #1 to #4 cover how to find the right companies. Once you have found them, the sooner you buy the stock, the sooner you start cashing its dividend.

The Rationale Used to Buy is Also Used to Sell
In the previous principles I have explained various metrics I look at to select companies to be part of my portfolios. Many investors think that selecting a good package of metrics with strict rules would be enough to build a profitable portfolio. I respectfully disagree.
I like to say that the human being behind the numbers is more important than the metrics themselves. The main problem with metrics and trends is that they tell you a story that has already happened. It doesn’t always tell you what’s coming up. Therefore, investors must sit down and think about the company, analyze its fundamentals, and determine what can happen next.
This brings us to one of the most important parts of your investment process; write down your investment thesis for each holding. Before making any purchase, I always take sufficient time to write down my investment thesis. In other words, I need to know why I’m buying shares of company X instead of company Y. The more research I completed on the company prior to writing my investment thesis, the less chance I have to be wrong.
My investment thesis must include my thoughts on the company’s fundamentals and growth vectors. It must describe how the business became successful, and how these characteristics will translate into growth in the future. Here’s an example of my investment thesis on BlackRock:
“BlackRock is not only the world’s largest asset manager by assets under management (AUM), but it is also a dominant leader in one of the fastest growing investment products: ETFs. As low-cost fees and passive investing solutions tend to grow stronger, more money is being transferred toward BLK. BlackRock offers investment products in all asset classes enabling it to generate fees regardless of whether investors are bullish or bearish.
BlackRock is a winner and a keeper for decades to come. BLK net inflows of assets under management continues to increase quarter after quarter. In other words; there is always new money coming in. The company has a strong relationship with several institutional clients. Institutional investors are more inclined to stay with their providers for several years than switching from one company to another in the short term.
Since 2012, BLK has doubled the number of users on its investing platform Aladdin. BLK expects the numbers of users to continue to grow at a very fast pace. In fact, there are tons of opportunities as Aladdin shows only about 20% market share currently.
The company has shown an impressive dividend growth rate for the past 7 years. Over the past 5 years, BLK maintained a 10%+ annualized dividend growth rate. Even better, the current payout and cash payout ratios are well under control. We expect a high single-digit dividend growth rate going forward even if the payout ratio permits low teens growth rates.”
This step in my process is quite time consuming. This is the moment where I make the decision of buying shares or not. Once I pull the trigger, the only reason why I would back down (e.g. sell my shares) is if the company doesn’t meet my investment thesis anymore.
Each quarter, I review my holdings and validate if my investment thesis is still valid or not. If a company doesn’t support the original thesis for why I bought it, it’s now time to say goodbye and sell the stock. For example, if BlackRock started to show negative inflows and would lose its edge in the ETF market or if another investing platform would steal market shares away from Aladdin, then I would reconsider my investment and probably sell my shares.
Therefore, I don’t sell upon bad news or bad results. I don’t sell if a stock is up by 40% or down by 20%. I sell if the company doesn’t meet my original thesis expectations. With this technique, I may end-up holding shares for decades and never sell some companies, and rapidly sell others after only a few years in my portfolio.
I also sell when a company suspends or cuts its dividend – that’s an immediate sell trigger. Technically, you shouldn’t get to this extreme by following Dividend Stocks Rock’s dividend growth model. Since 2013, none of our DSR portfolios has suffered a single dividend cut. However, we understand our methodology is strong, but not flawless.
Since we follow revenues, earnings and dividend metrics, we will highlight stocks that will eventually have a problem paying their dividend. Each quarter, we review all stocks in our portfolios and give them a PRO rating along with a Dividend Safety Score. We look at their financial results and answer these two questions:
-
A) Is the company heading towards our expectations (e.g. is the potential being realized or was it just a mirage)?
-
B) Does the company still show future upside potential (the stock may go up, and still shows it could climb higher)?
When the answer to one of these two questions is a blunt “no”, the sell is triggered.
Finally, my investment decisions are motivated by the fact that the company confirms my investment thesis. Once the reasons (my investment thesis) why I purchased shares of a company are not valid anymore, I sell and never look back.

Think Core, Think Growth
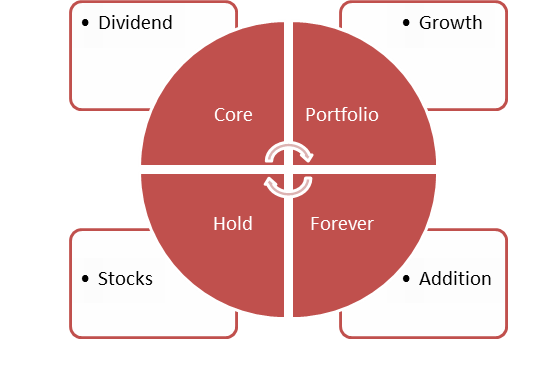
We have a different way of managing our DSR portfolio compared to the regular “buy & hold” dividend investor. We tend to divide our portfolio into two segments: the core portfolio built with strong & stable stocks meeting all our requirements. The second part is called the “dividend growth stock addition” where we may ignore one of the metrics mentioned in principles #1 to #5 for a greater upside potential (e.g. riskier pick as well).
It’s easy to select a company like Johnson & Johnson (JNJ) since it has been in business forever and has always paid a good dividend. However, picking-up a falling knife or a low yielding stock to boost total return potential is a different thing.
While the core section is like any other dividend growth portfolio, the additional segment will require closer follow-up. This is the part of our portfolio that will most likely generate the most volatility. Since we don’t have the same risk tolerance, we have divided our portfolios into “conservative” and “growth” models. This means the conservative one won’t likely include the “addition” segment and will concentrate on the core portfolio.
Having both strategies combine in a single portfolio will bring you an effective balance between a steady 3-4% yield and total stock return appreciation that sometimes classic dividend portfolios miss. Our goal is to scavenge through the market and highlight strong dividend growth stocks, so you don’t have to spend hours doing the painful research. Since 2013, our investing methodology has proven to be successful and we continue to implement and optimize our investing principles.
How This Wisdom is Reflected in Dividend Stocks Rock
This concludes the investing principles I use to manage my dividend growth portfolio. In the end, the true power of dividend investing is materialized through time. The longer you keep your dividend growth stocks, the higher the return you will earn from your investments.
Dividend Stocks Rock is an online membership site that gives you access to all the tools and techniques you can personally use to build a rock solid portfolio. This is not about stock recommendations or guru principles. It’s about sound investing decisions made based on solid stock research. And 95% of the work is done for you.
The Dividend Stocks Rock will build your knowledge, skills, and investment capability from the ground up. You’ll master the techniques you need to understand what drives portfolio growth and individual stock growth to build the portfolio you want. Most importantly, it will give you the data at your fingertips to allow you to put the process into action from day 1.
01 The Dividend Stocks Rock Core Model Portfolios
The first action you should complete once you register with DSR is to select a portfolio in line with your investment goals. We offer a portfolio for each type of investor. Our portfolios have been built and customized according to 2 priorities: risk profile and size. This is how you can start from a small conservative or growth portfolio with 10 holdings and grow it to a 500K account with 30 stocks. Each portfolio comes with a quarterly updated booklet including asset allocation, recent comments on each holding, stock cards and a list of current buy opportunities within the portfolio. All users receive buy & sell email alerts when we perform a trade.
02 The Rock Solid Ranking
The second step of your investing journey through DSR should be to screen through our Rock Solid Rankings in the search for your next potential purchase. Companies appearing in our rankings are either closely followed by our team or suggested by other members like you. You will also find all companies included in our DSR portfolios. We rank each company according to their potential upside. Twice a year, we run a dividend discount model (DDM) calculation to complete our analysis of strong dividend growth businesses. Once a month, we update the current stock price value and calculate the potential upside (+) or downside (-) and publish it on the Rock Solid Ranking. This list is meant to be a tool to quickly identify buy opportunities.
03 DSR Stock Cards
As a third step in your investing process, you have access to a comprehensive and efficient stock report library. Each company we review throughout the year is being documented here with a complete analysis for you to read. In a condensed pdf format, you can review a company going from their business model, dividend perspectives, risk potentials and finish with a fair valuation. In the glimpse of an eye, you can have a clear idea if this company should be in your portfolio. As a member of DSR, you have the privilege of requesting additional stock cards for those companies that haven’t been reviewed by our team yet. This “on demand” service is complementary and an integral part of your subscription to DSR. This tool has been especially designed to optimize your precious decision making time.
04 The Dividend Stocks Rock Premium Newsletter
Financial markets evolve rapidly creating waves for your portfolio but also opportunities. Our DSR premium newsletter is being issued twice a month. Our first issue, published on the first Friday of each month concentrates on a specific industry or topic. We go throughout market events and identify the best moves to make. Our second issue, published on the third Friday of each month is an update of our “buy list”. Taken from our Rock Solid Rankings, we explore in depth companies shown as undervalued. As a DSR member, you have access to our complete archive where you can read about our previous trades and industry reviews. This is a real gold mine of information for those who wish to dig deeper before making investment decisions.
What subscribers say about DSR:
“I really enjoy the portfolio updates and explanations that you provide of the reasoning behind the changes that are occasionally made. I think you are doing a very good job and are offering good value for the money.”
Richard
“As an absolute beginner I wanted to say I enjoyed the newsletter and I appreciate the opportunity to increase my knowledge. I look forward to working through the book. Best regards.”
Nic
“I’ve particularly enjoyed the previous lists of stocks with descriptions of them and the philosophy for owning a stock. With that, the stock cards are really great as it provides me with a quick glance as to how a company is doing and if it is undervalued.”
Donald
“I am happy with the service you offer, and I like the additions you’ve been making. I really like the Dividend Pro piece because as a DIY Investor, even though I think I’m doing a fairly good job managing my account I like having someone else’s perspective. I like the Stock Cards and you do a great job of responding to emails quickly. I like the newsletters and the informative information you provide. It is nice to get information in layman’s terms, especially when the investment world is so filled with jargon. Your team is doing a great job.”
Royan
SO HOW DO YOU GET ACCESS TO DIVIDEND STOCKS ROCK?
Dividend Stocks Rock has been created to provide powerful tools for investors ready to take control of their portfolio. Learn how to become your own portfolio manager and save thousands in management fees. Considering those fees saved, the investment in DSR is paid back within a month. We will do everything in our power to reward your trust by providing you efficient investing tools.
Your Subscription Includes:
- The Dividend Toolkit and its Spreadsheets – Learn how to calculate stock values
- The best 2019 Dividend Stock Picks Book – Start the year with our 20 US and 10 CDN selection.
- A starting point to ease your mind – we have 15 portfolio models including booklets and quarterly analysis. (including our new Retirement portfolio (4.5%+ yield))
- A fast way to identify undervalued stocks – our Rock Solid Ranking tracks 325+ stocks and provides upside potential.
- An answer to “when should I buy/sell?” – we send you all our trades with our investment thesis behind it.
- Lots of free time to enjoy life – we go through the market to find the most interesting companies and we provide you with actionable content.
- A personal assistant that does all the work for you – we have reviewed over 325 dividend stocks on the site, you can ask us to review any stocks in your portfolio.
- A risk-free investment – we offer a 60 day No Questions Asked Reimbursement Policy
- The best deal of your investment journey – your price will never increase once you become a member.
60 Days No Question Asked Reimbursement Policy
The purpose of Dividend Stocks Rock is to provide you with high quality information to help you in your investing journey. Our rates are made to be affordable for any investor. This is also why Dividend Stocks Rock makes the following guarantees:
- 60 Days No Questions Asked Reimbursement Policy – you can cancel your subscription and get full refund during the first 60 days of your membership
- No contracts, cancel any time
- Your price will never increase after subscribing
NOTE: The Dividend Stocks Rock is a membership site with access to both online pdfs and online content. This platform does not include stock recommendations so please read our terms of use & legal information before proceeding. After you complete your purchase, you will get instant access to our resources and tools. This is not a mailed program.
